Ranter
Join devRant
Do all the things like
++ or -- rants, post your own rants, comment on others' rants and build your customized dev avatar
Sign Up
Pipeless API

From the creators of devRant, Pipeless lets you power real-time personalized recommendations and activity feeds using a simple API
Learn More
Comments
-
Update: while I know where the seg fault occurs, I have no fucking clue why it happens this does not make sense at all
-
@LotsOfCaffeine Use valgrind. It'll tell you where the memory was first allocated, where it was eventually freed, and then where the access violation occurred.
-
@junon I've seen valgrind before, but I got it working with gdb.
I got a core dump and inspected it (you can actually do this with vscode's C/C++ extension, though I used the command line).
It showed me exactly where I got the seg fault but I didn't know why that one variable was suddenly an invalid pointer.
I talked to a colleague who knows about the company internal library which I used and he explained that the variable was destroyed already -
@LotsOfCaffeine Yes, that's my point. You can find out where a segfault occurs easily. Valgrind actually helps you understand what happened for it to become invalid memory. As far as I know, GDB does NOT do this.
-
@junon I mean I've used valgrind vaguely but idk what options and tools it actually has
-
@LotsOfCaffeine
valgrind --leak-check=full ./your-program -whatever -args -you -want
If a "leak" doesn't actually mention any of your code in the call stack, it's a false positive (usually) and can be ignored.
Also, sometimes it falsely marks some static allocations as leaks. But that's rare anymore.
Otherwise, the rest is in the output, pretty self explanatory.
Related Rants
-
 Dacexi24
 When there are only 2 pages on Google you know you're in serious shit.
 -
 practiseSafeHex20Fixing a parents iPhone, episode 1. Problem: "Whatsapp is gone off my phone" Debugging: Me: *unlocks phone...
 -
 nachocode6
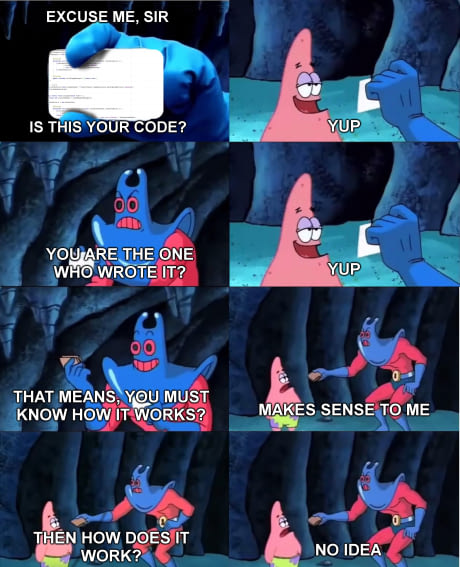
 When you talk to other devs about what their code did. I also relate myself to this.

I never knew that debug symbols, a core dump and gdb would be so powerful to debug
The command line is peak ol' reliable
random
debugging
gdb
segmentation fault